
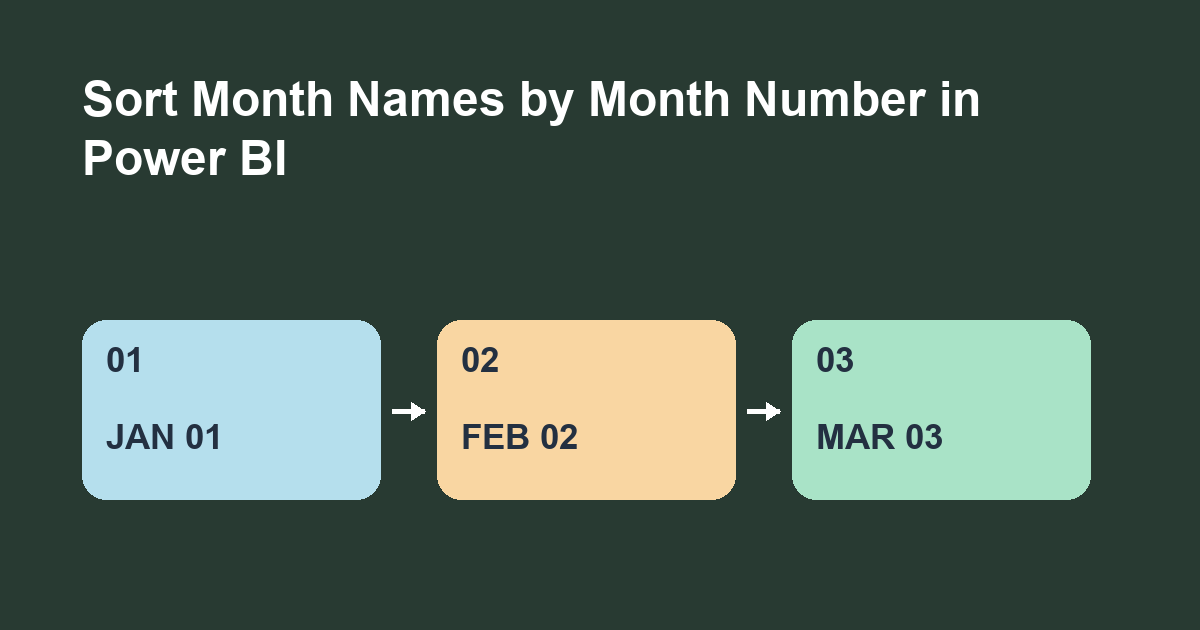
Set the Month column to sort by MonthNumber in Power BI Desktop, then set the chart to sort by Month ascending. This displays text labels in calendar order.
Make a test table
Use Enter data to create Month, MonthNumber, and Visits. Enter March with 3 and 18, January with 1 and 12, and February with 2 and 24. Set MonthNumber to Whole number. The source order, alphabetical order, and visit totals differ, which makes the sort easy to check.
Configure the chart
In Report view, select Month. Choose Column tools > Sort by column > MonthNumber. Build a clustered column chart with Month as the category and sum of Visits as the value. If needed, use the visual menu to sort by Month ascending. February should be the middle and tallest bar. If it appears first, check whether the chart is sorting by Visits.
Use a key that matches the label
Each distinct label must have one sort value. January can occur in many rows as long as its key stays 1. Across years, use a distinct label and key such as Dec 2026 and 202612. Month names alone group the same month from multiple years within the current filter context.
Check the order in a table first
Before troubleshooting the chart, add a temporary table visual with Month and MonthNumber. If MonthNumber is summarized, set it to display the individual value or inspect the rows in Table view. Look for an unexpected blank or a spelling variation such as Mar alongside March. The sort rule orders the labels you have. It will not combine two spellings into one month.
Check the report after a change
Add a filter that leaves only January and March in the practice chart. The expected order is still January followed by March. The missing February is a filter result. If March appears first, check whether the visual is descending or sorting by a measure. Then clear the filter and confirm that February returns between the two labels.
Choose an order for the question
A calendar view and a ranking view answer different questions. Calendar order makes it easy to see the change from January to February to March. Sorting by Visits makes it easy to see which month had the highest total. If readers need both views, label each chart clearly and check its visual sort separately. A model sort key gives you the calendar sequence when the chart is sorted by Month.
Version and exercise
These steps require an editable Power BI Desktop model. Microsoft's separate service example uses a tooltip field for visual-level sorting. Add April with a key of 4 and 5 visits. It should come last even though its bar is shortest.